
About This Primer
I am researching and writing this series to take a big-picture look at COVID-19. I’m taking a step back from the daily news information overload and fact-checking the (even larger) load of misinformation. I announced this project in June and invited questions from my friends. Part 1 covered the basics of viruses and coronaviruses. Part 2 dealt with SARS-CoV-2 on the level of individual health. Today’s article will be followed by Part 4, “Coronavirus and Society”.
In today’s installment, I start out with a discussion of COVID-19 data: how it is collected and what it can and cannot tell us. In section II, I discuss efforts to pin numbers on the virus to summarize this outbreak or compare it to others. Section III recaps the history of this pandemic and human responses to it in the first several months.
I. Data
II. Viral Vitals
III. Medical Impact And Response
IV. Citations
I. Data
A. Where the Data Comes from
As you can imagine, no single agency could count every case, illness, or death. It’s a grassroots reporting effort. When you get your nose swabbed, your sample is sent to a lab for processing. Hospitals have labs as well as doctors who make personal diagnoses. Labs and hospitals report to local governments, which report to state or national governments. In the United States, the CDC issues reporting guidelines about who must report data, what they must report, and to whom. 2
Finally, national totals are reported to the World Health Organization for a global count. The most commonly reported vital statistics are the daily SARS-CoV-2-positive test results (“cases”), hospitalizations, hospitalizations requiring intensive care, and deaths. Private websites such as Johns Hopkins gather the data published by local and national governments. The data in most media articles will be drawn from a major consolidated database such as the COVID Tracking Project.
I have always felt partial to Worldometer. This website honed its census skills estimating real-time populations. 1 3 Worldometer reports daily coronavirus figures for all US states and many counties, each nation, and the world. It explains its methodology to account for a lag in the reporting system. 4 Local counts are the most complete and current, so Worldometer relies on local data to supplement national information as much as possible.
B. Sources of Uncertainty
We could not possibly expect a decentralized, worldwide tabulation in a time of crisis to be 100% perfect. Some tests are more accurate than others. Cases might get lost or duplicated in the reporting system. The cases and deaths are usually categorized as “probable” or “confirmed.” 2 Changes or differences in these definitions can lead to disagreements between databases.
The greatest limitation of official data is that it only applies to reported cases. Since COVID-19 is mild for most people, and since testing hasn’t kept up with viral contagion, many infections will never enter the reporting system. Therefore, official records will under-report infections and over-report their death rate. This is a big topic that will be detailed further below.
Meanwhile, the death rate tends to be under-reported when we are tracking recent infections. For cases that are less than a month old, the data will show that they are non-fatal just because these patients haven’t died yet. While the number of infections continues to rise, a high percentage of cases are new and therefore unresolved. The most accurate death rates will come from the data of months past.
The point is not to conclude that official figures are useless. With numerous factors that both overestimate and underestimate reality, we can regard the reported numbers as middle-ground ballpark figures that are as precise as reasonably possible. Even if absolute figures are murky, they can still be useful for drawing comparisons across times and places. However, the most accurate information will not be available until the pandemic is over.
You may see references to an “excess deaths” statistic, which is appealing in its simplicity. The thought is that if we just count all deaths in 2020 and then subtract the baseline number of deaths in 2019, we will get the magic number of coronavirus-caused deaths. The excess death measurement was useful at the beginning of the outbreak before people had time to respond to it. However, this year’s social distancing and recession have affected death rates in so many other ways, such as the impact on accidents, medical practice, and other infectious diseases, that they drown out the impact of COVID-19 deaths. Excess deaths are no longer informative.
II. Viral Vitals
Reid S. asked, “Please determine the death rate!”
We are all anxious for clear-cut answers about this bug’s vital statistics. Unfortunately, if you want honest answers, you’re going to get complicated answers. Virtually every measure of a virus is impacted by human activity. The numbers vary greatly across time, place, and circumstance.
A. Reproduction Numbers
Some diseases are more contagious than others. The reproduction number, R, counts how many healthy people an average sick person will infect. The most disease-specific measure of R occurs at the very onset before people have time to respond to it. That value is called R0. The goal of preventive programs is to subdue R below 1 so that infections decrease. While R is above 1, even slightly, infections will continue to increase exponentially.
SARS-CoV-2 studies from Europe 5 and China 6 estimate R0 in the range of 2 to 9, most likely 4 to 6. This is much higher than seasonal flu, a little higher than SARS, and lower than chickenpox or measles. As of early August, R is estimated at 1.1 globally. Roughly half of the world’s countries are still above 1. The US has just reached R = 1, suggesting that this country is nearing its peak number of daily new infections. 7
B. Fatality Ratios
Brad B. asked about the impact of senior centers on death rates.
Of all reported cases of COVID-19 that have had time to run their course, 5% of them have been fatal as of mid-August. 8 The confirmed case-fatality ratio ranges from 0% in Vietnam (yep) to 15% in the UK! Singapore and other small countries like Qatar and the U.A.E. have young populations because they have large immigrant work forces. They are also rich countries with good hospital facilities. Despite major outbreaks, these countries have kept their death rates below 1%. The UK is a standout with its 15% case-fatality ratio. 9 The high British rate is largely due to slow and feeble government response to testing, tracing, and imposing public health standards. 10
By far the two most vulnerable populations are smokers and the elderly. Nursing homes are ground zero in this pandemic. With 1% of the US population, nursing homes report almost 25% of COVID-19 cases and 40% of its deaths. 11 Smokers are 14 times as likely as non-smokers to develop critical symptoms. 12 The death rate is higher in men than women. This pattern probably reflects the fact that most smokers are men.
C. Case-Infection Ratios
Brad B. asked, “What is the estimate of the number of asymptomatic and mild cases?”
Mitzi M-H. asked about the discrepancy between virus swabs and antibody tests
“Silent spreaders” are a big part of the COVID-19 story. The disease is contagious during an incubation period before symptoms appear. Many people carry the virus without ever knowing it. There is a great deal of interest in determining the “true” number of infections, for medical and political reasons alike.
The best way to detect whether a person has ever been exposed to a virus is with an antibody test. Although some antibody tests have had highly publicized flaws, there have been more reliable trials, and they yield a similar result. In April, lab analysis of randomly drawn blood samples estimated that there were about ten times as many infections as confirmed cases. 13 This ratio is variable too, as it depends on the quality and especially the quantity of swab tests.
Meanwhile, mathematical epidemiologists are working with the most reliable data (death toll and the best-measured infection-fatality ratios) and are running SIR algorithms to estimate the true number of infections. One sophisticated mathematical model in May estimated that infections are about four times more prevalent than reported cases worldwide, with a possible range of 2 – 12. 14
Many people argue that coronavirus is “less deadly than we thought” because of all the previously unreported infections that did not develop into serious cases. That is true in the sense of a death rate, although it obviously does not reduce the sheer number of deaths. In fact, the number of COVID-19 deaths is under-reported too, by a factor of up to 2. 15
Put it all together, and what do you get? I’ve done the math for you; you’re welcome. For a random person infected with the virus today, the probability of death is probably closer to 1% than 5%. Whatever that means for your peace of mind is up to you!
The good news is balanced by bad news anyway. The large pool of untested infections means that for every case that is followed up with quarantine and contact tracing, there are about ten others who go undetected. This highlights the need for much, much more testing, and not just for sick people.
By the way, even accounting for the unreported infections, still only about 1% of the human population has the antibody. We’d need a prevalence of about 80% for herd immunity. 16 Letting the disease play itself out to herd immunity would therefore multiply the death count by 80, to about 50,000,000. Needless to say, that’s an unacceptable solution.
III. Medical Impact And Response
A. Devastation by Concentrated Impact
B. Effectiveness of Social Measures
A. Devastation by Concentrated Impact
Like many social ills – poverty, crime, overpopulation – the impact of COVID-19 is not distributed evenly throughout the world but is spotty. It has devastating impact on a few localities like dense cities and senior centers. In those localities, it hits the weakest links in the medical supplies and services chain.
When WHO declared COVID-19 a global health emergency on January 30, the disease had killed only 200 people. If those deaths had been spread around the world, nobody would have noticed. They would have been a drop in the bucket of 5,000,000 normal deaths that month. But those deaths, as well as 10,000 non-fatal cases, were concentrated around one city. Wuhan probably could have handled them if they had been spread out over a year. It was the concentrated impact of 10,000 cases in one city in one month that was so exceptionally stressful. Wuhan hospitals were so short on beds and ventilators that the government erected a new hospital in two weeks. Similar stories of overwhelmed resources occurred in Milan, Tehran, and New York City by early March. Ventilators were the scarcest need. Not every hospital has them; some countries have only a few. 17 By March, demand was already ten times the global supply. 18 Making new ventilators requires a massive global supply chain; it’s not easy to crank them out. 19 Medical personnel and ICU beds are other resources that got exhausted quickly.
B. Effectiveness of Social Measures
Brad B. asked if there has been a change in the hospitalization rate.
The early urban hotspots were warnings. If left to spread out of control, the virus had the potential to strike every city like that eventually. WHO upgraded the disease to a pandemic on March 11, and governments around the world took measures shortly afterward. This led to some enlightening experimentation. Two countries that had exemplary success curbing COVID-19, South Korea and Iceland, did so by immediately implementing rigorous programs of testing, contact tracing, and quarantining. Iceland finished assembling its coronavirus task force literally hours before the country’s first reported case. 20 Meanwhile, China and Italy each put 60,000,000 people on lockdown. Italy’s outbreak has been on a steep decline since late March. China enforced its lockdown more strictly, and its wave was effectively over before Italy’s began.
Facemasks and social distancing have been effective at slowing the spread everywhere and bringing it under control in half the world. Masks reduce transmission by up to 50% when used widely. 21 The countries that see masks worn most faithfully, in Asia, have low transmission rates. 22 Without any mitigating behavior, this virus could have infected 7,000,000,000 people and killed 40,000,000 this year. 23 Good job, us!
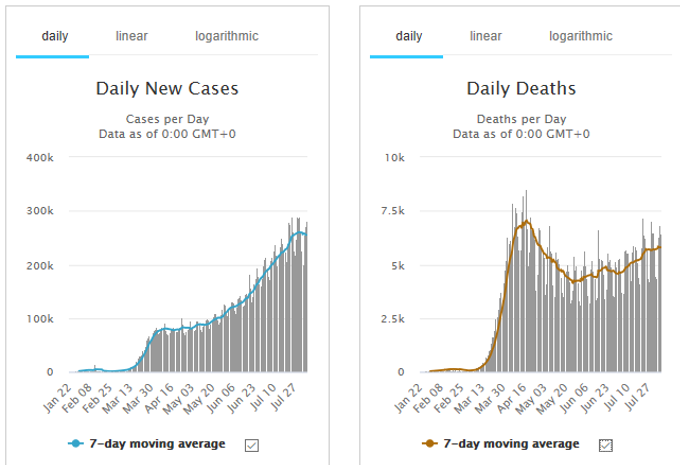
The number of daily deaths took a significant dip in April despite rising case counts. 24 This can’t be explained away with rates or miscounts, so it seems to reflect genuine improvement in public health. Maybe defenses got tightened up at nursing homes or the most vulnerable people got more serious about staying home. Perhaps doctors learned from experience, or hospitalizations got spread out more evenly across geography and time.
The biggest problem this year has been lack of preparedness, coordination, and resolve. That is showcased by the approaches of the United States, United Kingdom, and Sweden. These are countries that like to flout government orders, 25 and their governments were slow to acceptance anyway. Now, the US has the world’s largest case load, the UK has the highest death rate, and Sweden has one of the highest reproduction numbers.
However, very few countries were as prepared as they should have been. A 2019 study ranked countries on their pandemic preparedness. Its report card gave a global average of 40%. 26 “Few countries pay for action plans out of national budgets,” the report found. That explains why everybody had to scramble to legislate aid packages this year.
C. What to Look for Next
1. Africa
2. Reopening
1. Africa
Africa’s fate is one of the greatest unresolved questions. Although many African nations are woefully unprepared, so far, numbers are low across the continent. This is correlated to low testing, but the case-fatality ratio is low too. Africa is the youngest continent, so it could be that its population is truly resilient. 27 Cases are just starting to blow up in a few hotspots like Congo, Djibouti, and South Africa.
2. Reopening
Lockdowns cannot continue forever. However, when full mobility resumes, this pandemic will start all over again, a “second wave”. The only way to get the outbreak under control without a vaccine is to continue lockdowns until new cases are reduced to a trickle, then have a testing / tracing / isolation system ready at the starting line when the economy reopens. 28
We face challenges this fall as schools resume, pneumonia season begins, and sectors of the economy simply must reopen out of necessity. The hope is that we’ll be more prepared this time. Let’s hear it for second chances.
Continue to Coronavirus Primer Part 4: Coronavirus and Society
IV. Citations
- Game photo by Padaguan / CC BY-SA (https://creativecommons.org/licenses/by-sa/4.0), https://commons.wikimedia.org/wiki/File:Pandemic_board_game.jpg (accessed and saved 8/17/20). ↩
- Staff writer, “How to Report COVID-19 Laboratory Data”, US CDC (2020), https://www.cdc.gov/coronavirus/2019-ncov/lab/reporting-lab-data.html (accessed and saved 7/27/20). ↩
- https://www.worldometers.info/watch/world-population/ ↩
- Staff writer, “Worldometer COVID-19 Data”, Worldometer (2020), https://www.worldometers.info/coronavirus/about/ (accessed, saved, and archived 7/27/20). ↩
- Kevin Linka, Mathias Peirlinck, and Ellen Kuhl, “The reproduction number of COVID-19 and its correlation with public health interventions”, medRxiv (submitted 5/01/2020, peer review in progress), https://www.medrxiv.org/content/10.1101/2020.05.01.20088047v3 (accessed and saved 8/03/20). ↩
- Steven Sanche et al., “High Contagiousness and Rapid Spread of Severe Acute Respiratory Syndrome Coronavirus 2”, Emerging Infectious Diseases 26(7):1470-1477 (Jul., 2020), https://www.ncbi.nlm.nih.gov/pmc/articles/PMC7323562/ (accessed and saved 8/04/20). ↩
- Garegin Papoian et al., “The Covid-19 Accelerometer Dashboard: World Statistics of Rt (Effective Reproduction Number) (continuously updated), https://covid19-r0.com/ (accessed 8/04/20). ↩
- Global Worldometer data as of 8/16/20: Out of 15.6 million closed cases to date, 777,000 have resulted in death. ↩
- Staff writer, “Mortality Analyses”, Johns Hopkins University (continuously updated), https://coronavirus.jhu.edu/data/mortality (accessed and saved 8/04/20). ↩
- Jasmina Panovska-Griffiths, “Coronavirus: five reasons why the UK death toll is so high”, The Conversation (6/10/2020), https://theconversation.com/coronavirus-five-reasons-why-the-uk-death-toll-is-so-high-140005 (accessed and saved 8/03/20). ↩
- Jon Kamp and Anna Wilde Mathews, “As U.S. Nursing-Home Deaths Reach 50,000, States Ease Lockdowns”, Wall Street Journal (6/16/2020), https://www.wsj.com/articles/coronavirus-deaths-in-u-s-nursing-long-term-care-facilities-top-50-000-11592306919 (paywall). Summarized e.g. by Stephanie Soucheray, “Nursing homes might account for 40% of US COVID-19 deaths”, Center for Infectious Disease Research and Policy (6/16/2020), at https://www.cidrap.umn.edu/news-perspective/2020/06/nursing-homes-might-account-40-us-covid-19-deaths (accessed and saved 8/05/20). ↩
- Wei Liu et al., “Analysis of factors associated with disease outcomes in hospitalized patients with 2019 novel coronavirus disease”, Chinese Medical Journal (5/05/2020), https://journals.lww.com/cmj/Fulltext/2020/05050/Analysis_of_factors_associated_with_disease.5.aspx (accessed and saved 8/04/20). ↩
- See e.g. staff writer, “Commercial Laboratory Seroprevalence Survey Data”, US CDC (last updated 7/21/2020), https://www.cdc.gov/coronavirus/2019-ncov/cases-updates/commercial-lab-surveys.html (accessed 8/05/20). A survey of samples from ten US sites found actual infections mostly 6 – 12 times more prevalent than previously reported cases, with an outlier at 24 times. ↩
- Christina Bohk-Ewald, Christian Dudel, and Mikko Myrskyla, “A demographic scaling model for estimating the total number of COVID-19 infections”, medRxiv (5/26/2020), https://www.medrxiv.org/content/10.1101/2020.04.23.20077719v3 (accessed and saved 7/28/20). ↩
- Bohk-Ewald, op. cit. ↩
- Linka op. cit. at 8 (given more precisely as 78%). ↩
- Emma Smith, “These countries have only a Handful of ventilators”, Devex (4/09/2020), https://www.devex.com/news/these-countries-have-only-a-handful-of-ventilators-96970 (accessed and saved 8/05/20). ↩
- Jinshan Hong and Dong Lyu, “World Ventilator Demand Now 10 Times What’s Available, Says Maker”, Bloomberg (3/25/2020), https://www.bloomberg.com/news/articles/2020-03-25/world-ventilator-demand-now-10-fold-what-s-available-says-maker (accessed and saved 8/05/20). ↩
- Torbjorn Netland, “A better answer to the ventilator shortage as the pandemic rages on”, World Economic Forum (4/03/2020), https://www.weforum.org/agenda/2020/04/covid-19-ventilator-shortage-manufacturing-solution/ (accessed and saved 8/05/20). ↩
- Elizabeth Kolbert, “How Iceland Beat the Coronavirus”, The New Yorker (June 8 – 15, 2020), https://www.newyorker.com/magazine/2020/06/08/how-iceland-beat-the-coronavirus (accessed and saved 7/19/20). ↩
- Staff writer, “IHME models show second wave of COVID-19 beginning September 15 in US”, Institute for Health Metrics and Evaluation (6/11/2020), http://www.healthdata.org/news-release/ihme-models-show-second-wave-covid-19-beginning-september-15-us (accessed and saved 8/05/20). ↩
- Katharina Buchholz, “Asians Still Most Likely to Wear Face Masks Due to COVID-19”, Statista (4/21/2020), https://www.statista.com/chart/21452/share-of-people-wearing-face-masks-per-country-covid-19/ (accessed, saved, and archived 8/17/20). ↩
- Patrick G.T. Walker et al., “Report 12 – The global impact of COVID-19 and strategies for mitigation and suppression”, Imperial College London (3/26/2020), https://www.imperial.ac.uk/mrc-global-infectious-disease-analysis/covid-19/report-12-global-impact-covid-19/ (accessed and saved 8/05/20). ↩
- Graphs from Worldometer data, https://www.worldometers.info/coronavirus/ (accessed 8/06/20). ↩
- Vicky McKeever, “Most Brits just won’t wear face masks – here’s why”, CNBC (7/15/2020), https://www.cnbc.com/2020/07/15/most-brits-just-wont-wear-face-masks-heres-why.html (accessed, saved, and archived 8/17/20). ↩
- Michelle Nalabandian et al., Global Health Security Index, Nuclear Threat Initiative (Oct., 2019), https://www.ghsindex.org/ (accessed 8/05/20). ↩
- Uwagbale Edward-Ekpu, “The pandemic’s spread across Africa is being tempered by a young population, for now”, Quartz Africa (7/09/2020), https://qz.com/africa/1878885/africas-pandemics-spread-is-being-slowed-by-young-population/ (accessed and saved 8/05/20). ↩
- Sanche, op. cit. at 1470. ↩